
Site intelligence for every parcel you evaluate
Parcel ownership, utility territory, resource quality, and competitive activity in one place, so your team moves from map to decision faster.
Updated October 2026
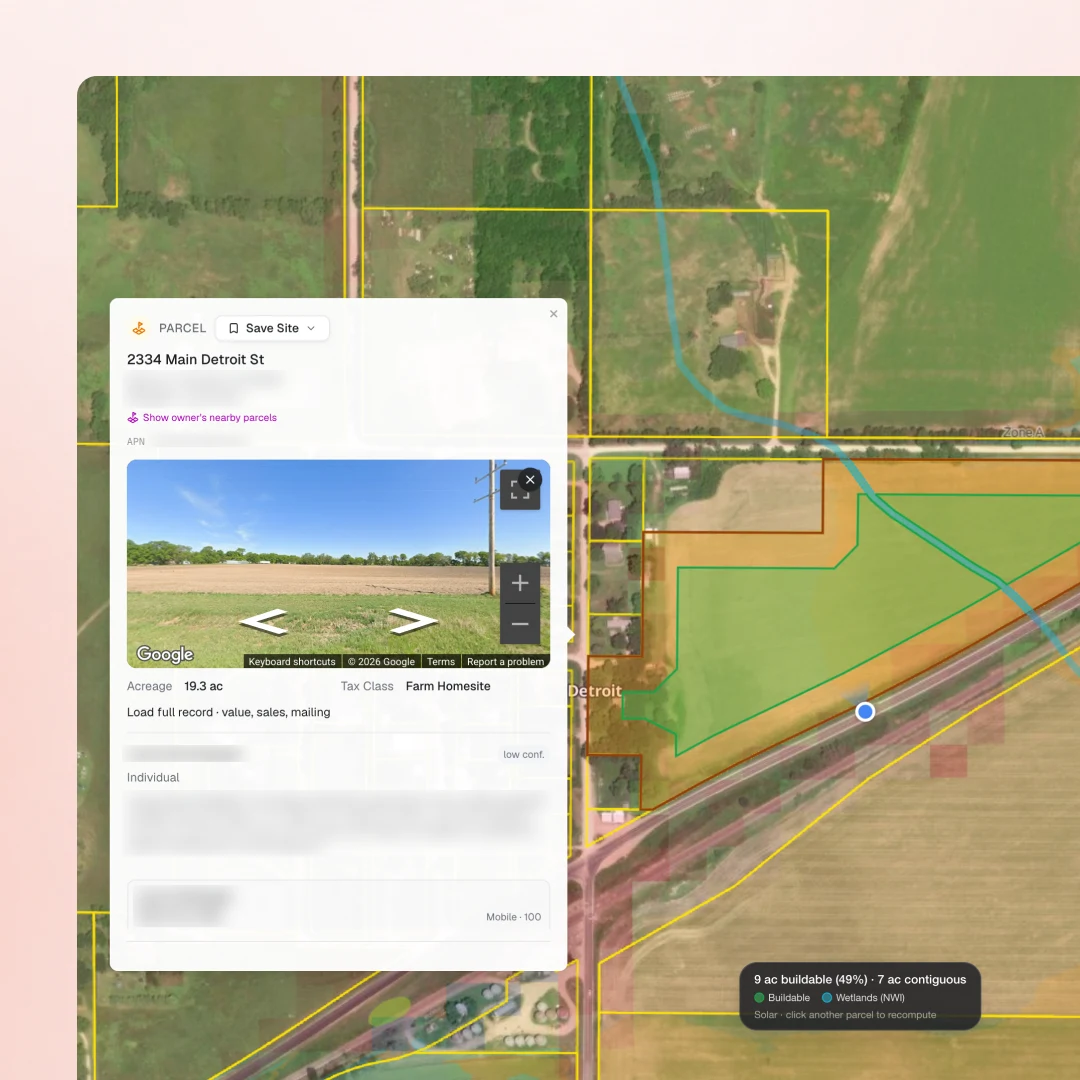
Browse the catalog
Every layer in the product, by category. Hover one for its publisher and provenance.
Infrastructure18
Transmission, substations, hosting capacity, power plants, pipelines, fiber, water, rail, roads, and airports, the built systems every project connects to.
- Transmission LinesHIFLD (DHS/CISA)
- Hosting CapacityUtility ICA / hosting-capacity portals
- Power PlantsHIFLD (DHS/CISA)
- Retired PlantsU.S. EIA
- SubstationsOpenStreetMap contributors
- Data CentersFracTracker Alliance
- PipelinesHIFLD (DHS/CISA)
- Fiber RoutesUniti, Segra, NTIA, Kentucky Transportation Cabinet, State of Michigan, OpenStreetMap contributors
- Fiber Availability (FCC)FCC
- Fiber POPs / IXPsPeeringDB
- Water Service AreasU.S. EPA
- Rail NetworkU.S. DOT BTS (NTAD)
- Roads (OSM)OpenStreetMap contributors
- Airports (FAA)Esri Living Atlas
- SchoolsNCES (EDGE)
- HospitalsHIFLD (DHS/CISA)
- Built Solar (USGS USPVDB)USGS / Lawrence Berkeley National Laboratory
- Planned TransmissionMISO, SPP and PJM (public ISO filings)
Grid & Market15
Interconnection queues, wholesale prices, utility territories, ISO boundaries, community solar programs, and IRA zones for reading grid position and revenue before you commit.
- Wholesale Electricity PricesGridStatus.io day-ahead market data
- Grid WithdrawalBasepoint
- Interconnection QueueISO/RTO and utility queues (LBNL-style unified)
- Interconnection CostsLawrence Berkeley National Laboratory
- Storage ArbitrageGridStatus.io day-ahead market data
- Basis RiskGridStatus.io day-ahead market data
- Utility TerritoriesHIFLD (DHS/CISA)
- ISO/RTO BoundariesU.S. EIA
- NYISO Load ZonesNYPA / NYISO
- Grid Signals (Live)GridStatus.io
- Energy CommunitiesU.S. DOE / NETL
- Opportunity ZonesU.S. HUD
- Community Solar ProgramsBasepoint, from each state's program page
- Low-Income Bonus Tracts (48E)NREL for U.S. DOE (Low-Income Communities Bonus Credit Program)
- 48E Priority Tracts (Energy Burden)NREL for U.S. DOE (Low-Income Communities Bonus Credit Program)
Environmental39
Flood, wetlands, soils, terrain, habitat, species, ordinances, and community constraints, the layers that decide what is actually buildable.
- FEMA Flood ZonesFEMA
- Wetlands (NWI)USFWS
- Land Cover (NLCD)USGS / MRLC
- Slope (degrees)Esri Living Atlas
- Topographic ContoursUSGS National Map
- Seismic Hazard (USGS)USGS
- Prime Farmland (SSURGO)USDA NRCS SSURGO
- Ag Land Quality (NCCPI)USDA NRCS SSURGO
- Crop Types (USDA CDL 2024)USDA NASS (served by USDA ARS)
- Soil Map Units (SSURGO)USDA NRCS
- Soil Drainage ClassUSDA NRCS SSURGO
- Hydrologic Soil GroupUSDA NRCS SSURGO
- Stream Classification (NHD)USGS
- Surface Water (Rivers & Lakes)Esri Living Atlas
- Critical Habitat (ESA)USFWS
- Conservation EasementsUSGS PAD-US
- Karst Terrain (USGS)USGS
- Superfund Sites (NPL)U.S. EPA
- Solar & Wind OrdinancesNLR (formerly NREL)
- Community SentimentBasepoint
- Migratory Bird FlywaysUSFWS Migratory Birds
- Military Airspace (FAA SUA)FAA (ADDS)
- Military Bases (DoD)DoD
- DOE / National LabsUSGS PAD-US + DOE
- EPA BrownfieldsU.S. EPA (ACRES / FRS)
- Disadvantaged Communities (CEJST)CEQ (mirror: Public Environmental Data Partners)
- Aspect (slope direction)Esri Living Atlas
- FEMA FloodwayFEMA
- Levees (USACE NLD)USACE
- Leveed Areas (USACE NLD)USACE
- Dams (National Inventory of Dams)USACE
- RCRA Hazardous Waste Sites (EPA)U.S. EPA (FRS)
- Toxics Release Inventory Sites (EPA)U.S. EPA (FRS)
- Leaking Underground Storage Tanks (EPA)U.S. EPA (Office of Underground Storage Tanks, ORD) and ASTSWMO
- Principal Aquifers (USGS)USGS
- Depth to Water Table (modeled)U.S. EPA EnviroAtlas (USGS model)
- Listed Species Ranges (may trigger consultation)USFWS and NOAA Fisheries (hosted by U.S. EPA)
- Listed Bat Ranges (may trigger consultation)USFWS (hosted by U.S. EPA)
- Whooping Crane Migration Corridor (may trigger consultation)USGS (hosted by the International Crane Foundation)
Land & Boundaries16
Parcels and ownership, zoning, federal, state, tribal, and protected lands, and the jurisdictional lines that shape a site.
- Buildable AreaBasepoint
- CountiesU.S. Census Bureau (TIGER)
- ParcelsRegrid (licensed) with county GIS fallbacks
- Zoning DistrictsRegrid (licensed)
- Solar Zoning RulesBasepoint
- Wind Zoning RulesBasepoint
- Urban AreasU.S. Census Bureau (TIGERweb)
- Federal LandsEsri Living Atlas
- State LandsUSGS PAD-US
- Protected Lands (PAD-US)USGS PAD-US
- Tribal LandsBureau of Indian Affairs
- Historic Properties (NRHP)National Park Service
- PLSS TownshipsBLM
- PLSS SectionsBLM
- Municipal Boundaries (Incorporated Places)U.S. Census Bureau (TIGERweb)
- Townships / County SubdivisionsU.S. Census Bureau (TIGERweb)
Resource Assessment4
Solar irradiance and yield, wind speed and power density, the first-pass resource read on any location.
- Solar IrradianceGlobal Solar Atlas (World Bank / Solargis)
- Solar YieldGlobal Solar Atlas (World Bank / Solargis)
- Wind Speed (100m)Global Wind Atlas (DTU / World Bank)
- Wind Power Density (100m)Global Wind Atlas (DTU / World Bank)
Hazards & Insurability4
FEMA risk indices, floodways, levees, and dams for hazard exposure and insurability screening.
- Hail Risk (NRI)FEMA
- Wildfire Risk (NRI)FEMA
- Landslide Risk (NRI)FEMA
- Tornado Risk (NRI)FEMA
Wind & Aviation3
Existing turbines, communication towers, and weather radar for wind siting and FAA exposure.
- Existing Wind Turbines (USWTDB)USGS / LBNL / ACP
- Communication Towers (FCC ASR)FCC (Antenna Structure Registration)
- NEXRAD Weather Radar SitesNOAA NCEI
Receptors & Structures3
Building footprints, school districts, and cemeteries for setbacks and receptor analysis.
- Building Footprints (USA Structures)FEMA / Oak Ridge National Laboratory
- School Districts (NCES)NCES (EDGE)
- Cemeteries (USGS)USGS The National Map
Pricing & Valuation1
USDA land values and cash rents for lease and acquisition context.
- USDA Land Values & RentsUSDA NASS
State data15
State-published records with no national equivalent: oil and gas wells, mined land, wetland inventories, farmland preservation, and state program areas.
- Oil & Gas Wells (Texas)Railroad Commission of Texas
- Oil & Gas Wells (Oklahoma)Oklahoma Corporation Commission
- Oil & Gas Wells (North Dakota)North Dakota Industrial Commission, Oil and Gas Division
- Oil & Gas Wells (Ohio)Ohio DNR, Division of Oil and Gas Resources
- Oil & Gas Wells (Kansas)Kansas Geological Survey
- Oil & Gas Wells (New Mexico)New Mexico EMNRD, Oil Conservation Division
- Oil & Gas Wells (Wyoming)Wyoming State Geological Survey (WOGCC data)
- Coal Mines, Undermined Land (Illinois)Illinois State Geological Survey
- Oil & Gas Wells (Illinois)Illinois State Geological Survey
- Wisconsin Wetland InventoryWisconsin DNR
- Managed Forest Law Land (Wisconsin)Wisconsin DNR
- Farmland Preservation Zoning (Wisconsin)Wisconsin DATCP
- Agricultural Enterprise Areas (Wisconsin)Wisconsin DATCP
- Community Solar by County (Illinois Shines)Illinois Shines (Illinois Power Agency program)
- Equity Eligible Communities (Illinois Shines)Illinois Solar for All (Elevate) and Illinois DCEO / ICJIA
The questions it answers before a site visit
Who owns it, and is it spoken for
Parcel boundaries, ownership records, and transaction history identify the right contact and whether land is already under option.
Which utility, which rules
Utility territory boundaries and service details for interconnection planning, rate context, and utility engagement.
Who else is here
Queue filings, permit applications, and land activity near your targets show competitive pressure while there is time to act on it.
Frequently asked questions
Where does the parcel data come from?
Licensed nationwide parcel data with ownership records, refreshed continuously, alongside public transmission, environmental, and regulatory sources documented per layer.
Can I bring my own GIS layers?
Yes. Draw or import layers, keep them in your workspace beside the catalog, and export as SHP, KML, or GeoJSON.
How current are the layers?
Each layer carries its publisher, license, and vintage, and fast-moving sources like hosting capacity maps are refreshed on a schedule with change history.
Is the 118-layer count padded?
No. It counts distinct documented layers, backed by roughly 155 upstream feeds, and each one is listed with publisher, license, and vintage on the Our Data page. Bundled sublayers are not double counted.
Can a site span multiple parcels?
Yes. Sites assemble from multiple parcels, and screening, acreage, and ownership run on the combined footprint rather than parcel by parcel.
Can I screen a whole region instead of one parcel?
Yes. Draw an area and run an origination study: it returns ranked candidate sites with buildable area and the fatal flaws that removed everything else.
Open the map on your territory
Name a county at the demo and explore its parcels, grid, and constraints live.